

Annual worldwide corporate R&D spending increased by 11% in 2018, totaling US$782bn in annual investment, based on an annual analysis of the 1000 largest global public companies by R&D spend conducted by PwC’s Strategy&. ”In recent years, businesses have invested more and more in R&D in order to remain competitive. Despite the record high levels of investment, the study’s findings are a further confirmation that innovation excellence isn’t something that can be bought by simply spending more on R&D. Rather, it’s the result of painstaking attention to strategy, culture, senior executive involvement, deep customer insights, and disciplined execution across the innovation cycle”, stated Ionuț Simion (photo), Country Managing Partner, PwC Romania.
The 14th edition of PwC’s Strategy& Global Innovation 1000 Study shows how innovation investment is related to long-term growth strategies, with R&D spending increasing across all regions and nearly all industries.
Globally, all regions saw an increase in R&D spend, most notably China (+34%) and Europe (14%) where spending grew by double digit rates, while North America (+7.8%) and Japan (+9.3%) saw only single digits increases in R&D. Overall R&D intensity – the measure of R&D spending relative to sales – remains at an all-time high of 4.5%.
”Locally, recent high-profile success models of UiPath, Bitdefender or Gecad give us reasons to be optimistic that the IT sector in Romania can produce top level players that are relevant on a global stage. Moreover, there are circumstances that make us believe, that in their areas of expertise, they can create technologies that will lead the next wave of development and can be competitive in an extremely dynamic market that invests heavily in R&D”, added Ionuț Simion.
In a five-year study of company performance and innovation investment relative to industry peers as part of this year’s report, 88 companies world-wide, across all regions and industries, were assessed as ‘high-leverage innovators’.
These companies outperformed their industry groups on seven key measures of financial success for a sustained five-year period, while at the same time spending less than the median of their industry peers on R&D as a percentage of sales. The basket of seven metrics of financial success include revenue growth, market capitalization growth, operating margin, gross margin, operating profit growth, gross profit growth, and total shareholder return (TSR).
While high-leverage innovators had similar operating and gross margins as other Global Innovation 1000 companies for the five years ending in 2017, the companies demonstrated sales growth which was 2.6 times greater than other companies on the Global Innovation 1000 list and with growth in market capitalization that was 2.9 times higher. High-leverage innovator firms achieved performance at least twice as high as other firms on all other metrics examined did.
Common characteristics of this set of high-growth companies include:
Alignment: 77% of fastest growing firms say their innovation strategies are highly aligned with their business strategies, compared with 32% of respondents that report slower growth.
Culture: 71% of respondents that report their companies’ revenues are growing faster than competitors say their corporate cultures are highly aligned with their innovation strategy, compared with 33% of companies that report slower growth.
Leadership: 78% of companies reporting higher than peer revenue growth say their executive team is highly or closely aligned with R&D investment and innovation strategy, compared with 53% for slower-growth companies.
Regionally, the list reflects the continued dramatic rise of China-based companies — from 3% in the first High-leverage Innovators assessment in 2007 to 17% in 2017. Europe too increased significantly from 18% in 2007 to 30% in 2017. The number of high-leverage innovators fell 45% for North American companies and 8% for Japanese companies.
By industry, the number of high-leverage innovators rose from 2007 to 2017 in telecommunications, consumer, healthcare, industrials, autos, and aerospace and defence, while the numbers fell in chemicals and energy, computing and electronics, and software and internet.
Of over 1,000 companies examined across three distinct five-year periods ending in 2007, 2012 and 2017; only two companies attained the status of high-leverage innovator across the entire 15-year period: Apple and Stanley Black & Decker.
“The success of these high-leverage innovators reaffirms a consistent finding of our study over time: there is no long-term correlation between the amount of money a company spends on its innovation efforts and its overall financial performance. Instead, what matters is how companies use that money and other resources, as well as the quality of their talent, processes, and decision making, to create products and services that connect with their customers needs”, explains Ionuț Simion.
Global Innovation 1000
The Strategy& Global Innovation 1000 study analyses spending at the world’s 1000 largest publicly-listed corporate R&D spenders and is now in its 14th year. Other key findings include:
Amazon maintained the top spot as the largest spender on R&D in the Global Innovation 1000 study, for the second year in a row. Sanofi and Siemens rejoined the Top 20 spenders globally.
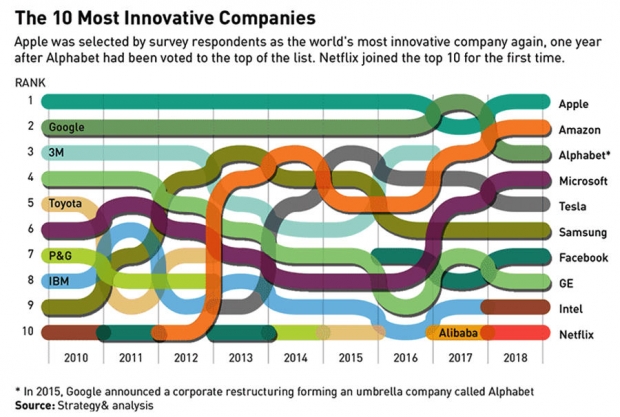
Apple regains the top rank as the world’s most innovative company from Alphabet, while Netflix joins the top 10 most innovative companies list for the first time, according to a global survey of R&D leaders and managers.
The consumer industry overtook the software & internet industry for the first time in five years, experiencing fastest year-on-year growth in R&D spending (26% vs 20.6%)
Healthcare industry in on track to become the biggest R&D spending sector by 2020.
Computing & electronics, healthcare and automotive industries together represent 60% of global corporate R&D spending in 2018.
China and Europe saw increases in the number of companies in the Top 1000, while North America (-5%), Japan (-6%) saw decreases.
1. The complete study and information on the methodology can be found at www.strategyand.pwc.com/innovation1000
About Strategy&
Strategy& is a global team of practical strategists committed to helping you seize essential advantage. We do that by working alongside you to solve your toughest problems and helping you capture your greatest opportunities. We bring 100 years of strategy consulting experience and the unrivaled industry and functional capabilities of the PwC network to the task. We are part of the PwC network of firms in 158 countries with over 250,000 people committed to delivering quality in assurance, tax, and advisory services.